Creating the forecast Route and View
Creating the forecast view is almost identical to creating the current weather view. The two start with the same basic Yeoman command:
yo angular:route forecast
Once you've run that command you should be able to see the controller file (app/scripts/controllers/forecast.js), view template (app/views/forecast.html) and the changes inside of app/scripts/app.js:
.when('/forecast', {
    templateUrl: 'views/forecast.html',
    controller: 'ForecastCtrl',
    controllerAs: 'forecast'
})
Once again, we will modify that route definition so it will accept a route parameter called cityID:
.when('/forecast/:cityID', {
    templateUrl: 'views/forecast.html',
    controller: 'ForecastCtrl',
    controllerAs: 'forecast'
})
Now that we have cityID coming through as a route parameter, we can set up the ForecastCtrl Controller.
Edit ForecastCtrl Controller
As we did with the CurrentCtrl Controller, we will set up our $scope variables so we can display our desired data in the forecast.html template. The controller will end up looking very much like the CurrentCtrl Controller:
angular.module('yourApp')
  .controller('ForecastCtrl', function ($scope, $routeParams, forecast) {
    $scope.cityID = $routeParams.cityID;

    $scope.forecastData = forecast.query({
        cityID: $routeParams.cityID
    });
  });
This is almost identical to the controller for the current weather view. The two views ultimately perform the same task: They both accept a cityID and then make a query to the OpenWeatherMap.org API using that ID so they can show the data in the template.
Edit the forecast.html template
Now that we've got the data ready for our template, we can modify the HTML in our app/views/forecast.html file so it will display our forecast properly. The most dramatic change between this display and the display of our current weather data is that we have weather information for multiple days. This means we will need to loop through the results and display all of the weather information (similar to how we looped through the citysearch results previously).
Here is what the template should look like after you are done making edits:
<h1>16-day Forecast for {{forecastData.city.name}} {{forecastData.city.country}}</h1>
<dl ng-repeat="prediction in forecastData.list" class="weather-forecast">
<dt>Forecast for {{weather.dt*1000 | date:'MMM dd, yyyy'}}</dt>
<dd>{{prediction.weather[0].main}}</dd>
<dd>{{prediction.weather[0].description}}</dd>
<dt>Temperature</dt>
<dd>Min: {{prediction.temp.min}} °F Max: {{prediction.temp.max}} °F</dd>
</dl>
<p><a ng-href="/#/current/{{cityID}}" class="btn btn-lg btn-primary">View Current Weather</a></p>
Notice that the 16-day Forecast API returns a slightly different data structure than the other API endpoints, so it is worthwhile to observe some of these responses and get an idea for how the data is arranged.
Of special note in the forecast data results are the list of forecasts (for up to 16 days of weather predictions) and the use of min and max temperatures in the forecasts.
In the example above, you can see that we are repeating a <dl> element for each day of weather predictions. Within each of those repeating <dl> elements, we are outputting some data. Most of this data is pretty standard, although the weather.dt value gets some special treatment using the AngularJS date filter.
The date filter allows us to convert a timestamp into a human-readable date. The OpenWeatherMap.org API formats the date as a "Unix Timestamp" that is based in seconds. This number represents the number of seconds that have taken place since January 1, 1970 (also known as the "Unix Epoch"). This is a common way of recording time.
The date filter is designed to take a timestamp and convert it to a human-readable format, but it is also designed to expect the timestamp to be in milliseconds, which is how timestamps are counted in Javascript. (And, yes, this is the number of milliseconds since January 1, 1970.)
In order to make the date filter work, we must multiply our timestamp by 1000, hence the formatting you see above:
{{weather.dt*1000 | date: 'MMM dd, yyy'}}
That variable is filtered through the date filter and becomes:
Aug 03, 2015
(or something similar).
Finally, notice that we kept a link at the bottom of this forecast view to return to the current weather view for our chosen city. (We can also click the "home" link in the top navigation to return home.)
Try it out
Now that you have set up your template, you can test out your view and you should see results streaming in from the OpenWeatherMap.org API. Add a little CSS to your app/styles/main.scss file and you can easily come up with something like this:
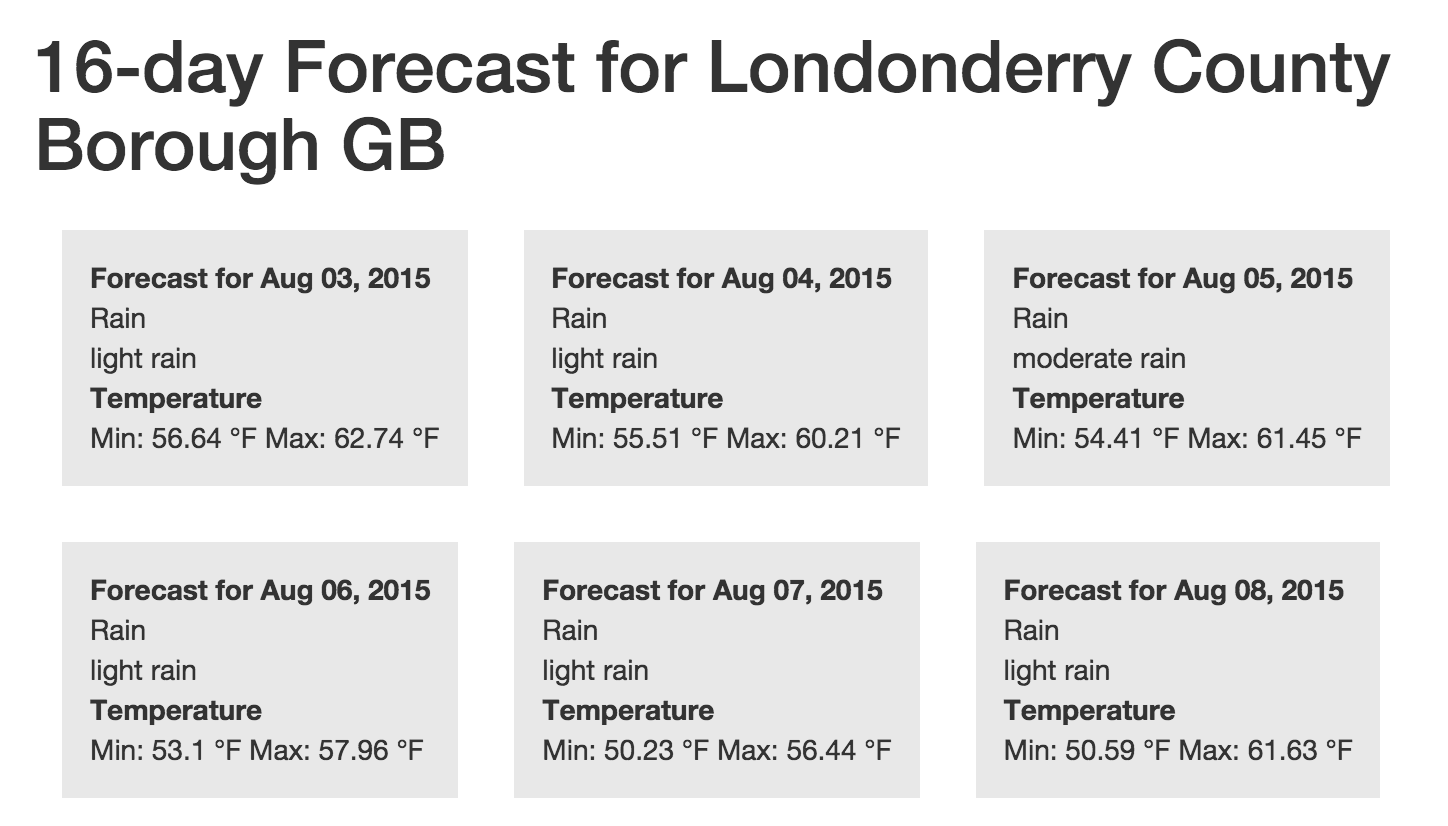
Huzzah! You almost have your whole basic feature set complete now. A user can find a city, view the current weather, and view a 16-day forecast. Those are the same basic features you'll find on most weather apps and websites. Congratulations! Now we can add the final touch: Allowing users to "save" their preferred cities.